Imixs Metrics
Imixs-Workflow provides runtime metrics based on the Microprofile Metric API. The Eclipse Microprofile Metrics specification provides an unified way to export Monitoring data (“Telemetry”) to management agents and also a unified Java API.
The Imixs-Metric Serivce is disabled per default. To enable the feature set the property ‘metrics.enabled’ to 'true.
metrics.enabled=true
How to access Imixs-Workflow Metrics
The Imxis-Workflow metrics can be collected by the metric rest endpoint depending on the application server.
# Wildfly
http://[HOST]:9990/metrics
# Payara
http://[HOST]:8080/metrics
This is an example how a Imixs-Workflow metric looks like:
....
application_workitems_total{event="20",modelversion="invoice-1.2",task="2001",type="workitem",workflowgroup="Invoice",workflowstatus="Open"} 1.0
application_workitems_total{event="1",modelversion="todo-1.0.0",task="2000",type="workitem",workflowgroup="ToDo",workflowstatus="Offen"} 3.0
application_documents_total{method="save"} 8.0
application_documents_total{method="delete"} 3.0
application_documents_total{method="load"} 133.0
application_transactions_total 5.0
.....
The Document and Workflow metrics are shown here. Each metric provides a set of tags defining the method and additional metadata like the WorkflowVersion or the current workflow event processed by the Imixs-Workflow Engine.
Anonymised Metrics
The metrics provided by the Imixs workflow platform are anonymized by default. This is important in order to comply with the data protection directives of many countries as well as within the European Union. But in some cases, it may be necessary to provide personalized metrics. For this purpose you can set the flag ‘metrics.anonymised’ to ‘false’ (default = true). In this case, the metrics are supplemented with the tag ‘user’ providing the corresponding userid.
METRICS_ENABLED: "true"
METRICS_ANONYMISED: "false"
Metrics Endpoint
The Metrics are based on the Eclipse Microprofile Metric API which means that the metric api is part of your application server. Depending on your platform you will get a lot of hardware and environment metrics together with the Imixs-Workflow metrics. The endpoint to access the metrics depends on your server environment.
Prometheus Configuration for Widlfly
The default metric api endpoint for Wildfly is:
https://[HOST]:9990/metrics
A Prometheus configuration to scrape the metrics from Imixs-Workflow can look like in the following example:
global:
  scrape_interval:     15s # By default, scrape targets every 15 seconds
  # Attach these labels to any time series or alerts when communicating with
  # external systems (federation, remote storage, Alertmanager).
  external_labels:
    monitor: 'imixs-monitor'

scrape_configs:
  # Prometheus itself
  - job_name: 'prometheus'
    scrape_interval: 5s
    static_configs:
      - targets: ['localhost:9090']

  # Imixs-Office Job
  - job_name: 'imixs'
    scrape_interval: 5s
    metrics_path: /metrics
    static_configs:
      - targets: ['app:9990']
Prometheus Configuration for Payara
The default metric api endpoint for Payara Server is:
https://[HOST]:8080/metrics
A Prometheus configuration to scrape the metrics from Imixs-Workflow can look like in the following example:
global:
	scrape_interval:     15s # By default, scrape targets every 15 seconds.
	# Attach these labels to any time series or alerts when communicating with
	# external systems (federation, remote storage, Alertmanager).
	external_labels:
	monitor: 'imixs-monitor'

scrape_configs:
	# Prometheus itself
	- job_name: 'prometheus'
	scrape_interval: 5s
	static_configs:
		- targets: ['localhost:9090']

	# Imixs-Office Job
	- job_name: 'imixs'
	scrape_interval: 5s
	metrics_path: /metrics
	static_configs:
		- targets: ['app:8080']
Prometheus Dashboard
To setup Prometheus with docker-compose you can add the container like shown in the following example:
  prometheus:
    image: prom/prometheus:latest
    ports:
      - "9090:9090"
    volumes:
      - ./prometheus/prometheus.yml:/etc/prometheus/prometheus.yml
      - prometheusdata:/prometheus/

volumes:
  prometheusdata:
From the Prometheus Dashboard you can test the data within your web browser:
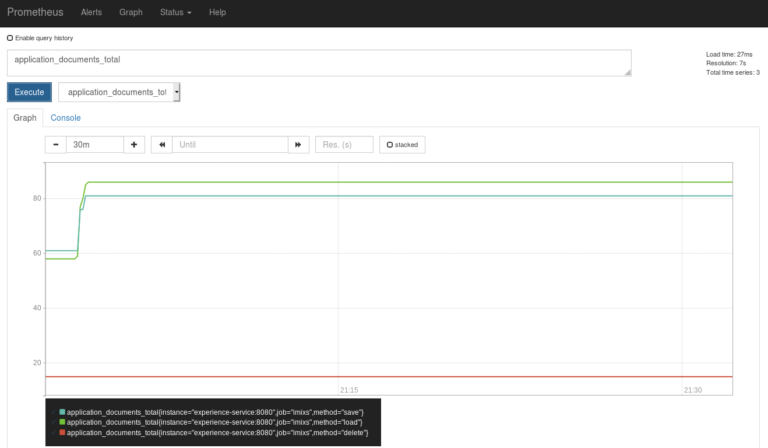
Monitoring Metrics with Grafana
grafana: image: grafana/grafana:7.1.0 ports: - “3000:3000”
To monitor you workflow you can easily connect your Prometheus server with a Grafana Instance. This allows you to visualize your metrics in an individual and more detailed dashboard.
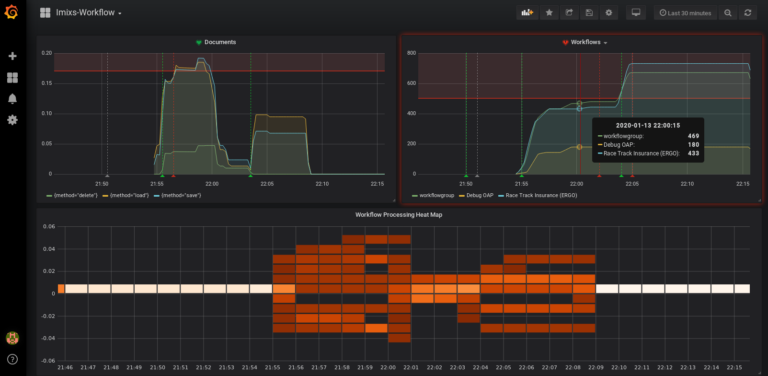
There are a huge amount of functions available in Grafana to analyze and monitor data. You can also activate individual alerts to notify your process owner about the load of your business processes.
Custom Metric Service
You can also implement your own custom metric service by just observing the #
@ApplicationScoped
public class MyCustomMetricService {

	@Inject
	@ConfigProperty(name = "metrics.enabled", defaultValue = "false")
	private boolean metricsEnabled;

	@Inject
	@RegistryScope(scope = MetricRegistry.APPLICATION_SCOPE)
	MetricRegistry metricRegistry;

	/**
	 * ProcessingEvent listener to generate a metric.
	 */
	public void onProcessingEvent(@Observes ProcessingEvent processingEvent) throws AccessDeniedException {

		if (!metricsEnabled) {
			return;
		}
		try {
			Counter counter = buildMetric(processingEvent);
			counter.inc();
		} catch (IncompatibleClassChangeError | ObserverException oe) {
			mpMetricNoSupport = true;
			logger.warning("...Microprofile Metrics not supported!");
		}
	}


	/**
	 * This method builds a custom Microprofile Metric
	 */
	private Counter buildMetric(DocumentEvent event) {


		// create a metadata object....
		Metadata metadata = Metadata.builder().withName(METRIC_DOCUMENTS)
				.withDescription("My custom metric").build();
		....
		........
		// export custom metrics....
		Tag[] tags = { new Tag("my_metric", method) };
		Counter counter = metricRegistry.counter(metadata, tags);

		return counter;
	}
}
Metric Types
The Eclipse MicroProfile Metrics Framework supports the different metric types:
Counter:
A simple incrementing counter that can only be increased Useful for counting events like API calls or errors
Example:
@Counted(name = "requestCount", absolute = true)
public void doRequest() {
    // Method implementation
}
Gauge
A gauge represents a single numerical value that can increase and decrease. Perfect for instantaneous values like CPU usage or active threads
Example:
@Gauge(unit = MetricUnits.NONE)
public int getQueueSize() {
    return queue.size();
}
Meter
The Meter metric measures the rate at which events occur over time Calculates mean rate, one-minute, five-minute, and fifteen-minute rates
Example:
@Metered(name = "requestMeter")
public void handleRequest() {
    // Request processing
}
Timer
A Timer combines Meter and Histogram for time measurements Measures both frequency and duration of events
Example:
@Timed(name = "processingTime")
public void processData() {
    // Time-intensive operation
}
Histogram
A histogram tracks the distribution of values over time Calculates statistical values like min, max, mean, and percentiles
Example:
@Metric(name = "histogram")
private Histogram histogram;
ConcurrentGauge
Specialized gauge for concurrent access Tracks current, maximum, and minimum concurrent invocations
Example:
@ConcurrentGauge(name = "activeRequests")
public void handleRequest() {
    // Concurrent request handling
}
Find out more about in the Imixs-Metrics Sub Project.
Documentation
Core Concepts
Building Applications
Operations
Project
Community
